Carbon Credit Price India vs China 2026
Carbon Credit Price India vs China 2026
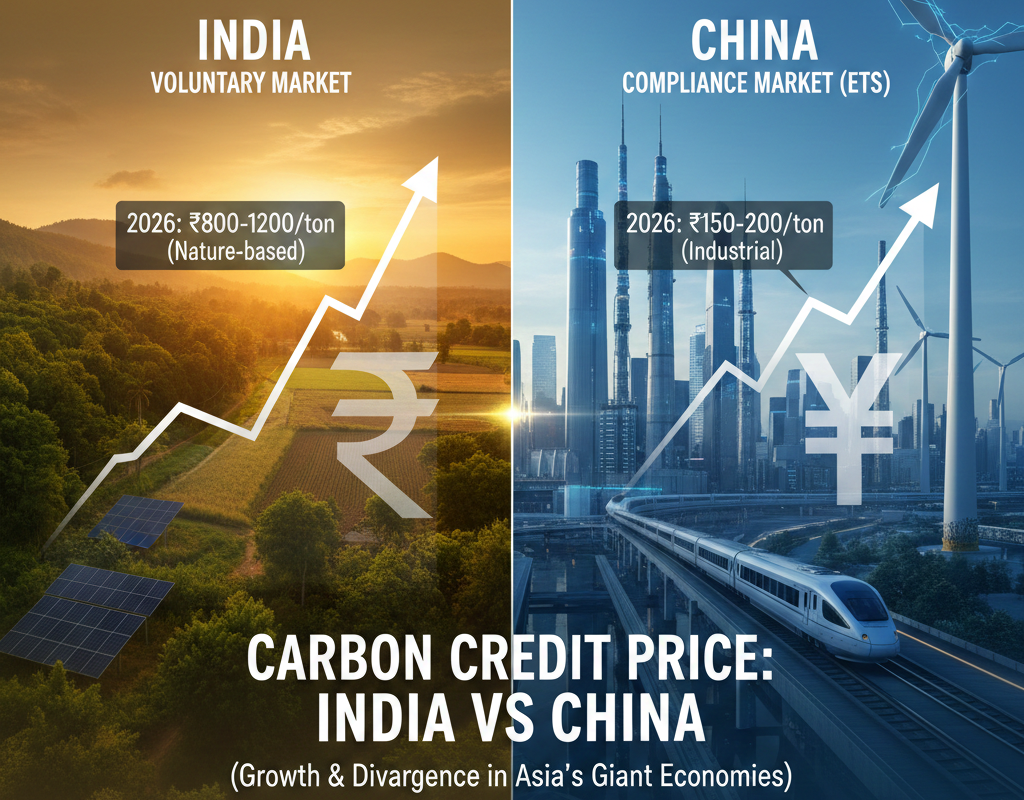
Carbon markets have emerged as a key tool for pricing greenhouse gas emissions, promoting decarbonization, and mobilizing climate funding as both China and India step up their climate action under both domestic and international commitments. Policymakers, corporations, investors, and other stakeholders with an interest in climate change must comprehend the carbon credit pricing scenario in India compared to China in 2026. The pricing patterns, market structures, price determinants, economic ramifications, legislative causes, and salient distinctions in the carbon pricing policies of the two Asian behemoths are all thoroughly examined in this essay.

Comprehending Carbon Pricing and Credits
The right to emit one metric ton less of carbon dioxide (CO₂) or CO₂ equivalent (CO₂e) is represented by tradable certificates known as carbon credits. By buying credits from companies that have cut emissions over objectives, they enable emitters with reduction responsibilities to make up for excess emissions. In order to internalize the cost of greenhouse gas emissions, carbon pricing basically sets a price per ton of CO₂e, whether through voluntary markets, carbon taxes, or emissions trading systems (ETS).
As governments work to achieve net-zero goals, carbon markets have grown dramatically in size and scope globally, with a yearly value of over $100 billion and growing coverage. Different regions have different price structures and average values depending on factors including market maturity, regulatory structure, compliance requirements, and economic priorities.
The structure and expected prices of the carbon market in India
Launched in July 2024, India’s national carbon market, represented by the Carbon Credit Trading Scheme (CCTS), establishes the foundation for a domestic emissions trading system (ETS) that aims to lower greenhouse gas intensity while promoting economic expansion. In order to shift to a market where enterprises that surpass predetermined emission intensity criteria can earn credits and those that perform below them must purchase them, the CCTS builds on India’s current Perform, Achieve, and Trade (PAT) structure.
Industry estimates indicate that when compliance trading starts, the initial phase of India’s carbon market should start at about $10 per metric ton of CO₂e, with some variation based on project type and sector.
Although this price threshold of USD 10/ton is far lower than in many more developed markets (such the EU ETS in Europe), it represents India’s goal to increase decarbonization without compromising economic competitiveness and the early, rate-based emissions intensity design. India envisions strong voluntary markets in addition to compliance markets, where prices can differ according to project characteristics such as forestry projects, renewable energy installations, and sustainable agriculture programs.
There are differences in domestic estimates regarding the actual trading value in Indian rupees. Voluntary carbon credit offers in India have historically been recorded by independent pricing trackers at an average of several hundred rupees per unit; however, these may vary over time based on verification requirements and demand.
China’s Carbon Market: Size and Cost
Over the past ten years, China’s carbon pricing infrastructure has grown significantly. Launched in 2021 and initially focusing on the power sector, its national emissions trading scheme (ETS) is now expanding to include other significant emissions-intensive industries like steel, cement, and aluminum, increasing the total emissions covered to over 8 billion metric tons annually, which accounts for the majority of the nation’s CO₂ output.
China’s ETS gradually shifts toward absolute emissions restrictions in important sectors by 2027, more closely resembling conventional cap-and-trade systems than India’s rate-based strategy. This implies that each covered organization has a fixed amount of allowances; larger polluters are required to purchase extra permits in the market, while those who emit less can sell their excess allowances.
India vs. China Price Level Comparison
There are a number of significant disparities between China and India’s carbon credit prices:
- Market Coverage and Maturity
China’s ETS is one of the biggest in the world and covers a variety of heavy industries, whereas India’s national carbon market is very young and only covers a few sectors. China’s carbon pricing therefore reflect increased trading activity and a wider need for compliance.
- Levels of Price
India’s initial compliance costs, according to current industry understanding, are probably going to be about $10 per ton of CO₂e, whereas China’s market has witnessed voluntary credit prices that range from $14 to $15 per ton, with some variation depending on demand and trading conditions.
- Design of Policies and Mechanisms
While China’s move to absolute cap setting enforces stricter emissions limitations, which may eventually lead to tighter supply and higher pricing, India’s ETS uses an emissions intensity approach that permits flexibility but may postpone significant price increases.
- Compliance vs. Voluntary Markets
Depending on project quality, certification, and buyer demand, India’s voluntary market, which runs in tandem with its compliance plan, may have different pricing points. Multiple pricing layers are produced by China’s combination of voluntary CCER credits and national ETS credits; compliance allowances frequently fetch more stable pricing than voluntary credits.
Price Drivers: Disparities between China and India
The difference in carbon credit prices between China and India is influenced by a number of factors:
- Compliance Requirements and Limitations
India’s rate-based approach distributes responsibility across sectors, preventing steep price spikes in the early years, while China’s stringent emissions limitations for important sectors generate demand for tradable allowances that can maintain or raise costs.
- Structure of Industry
While India’s emissions profile is diverse with a large emphasis on sectors like manufacturing and power that are slowly entering the market, China’s extensive heavy industry base—which includes steel, cement, and power—contributes more to trade volumes.
- Standards and Verification
The strictness of monitoring, reporting, and verification (MRV) standards influences price changes. Because of their reputation, markets with strong MRV typically draw more buyers and higher prices. Price confidence will increase as India develops its accreditation and registry systems.
- Global Demand
Prices will be impacted by cross-border demand for premium carbon credits as business commitments to net-zero rise worldwide. Compared to India’s developing market, China may draw more foreign demand due to its bigger market size and longer history of approved loans.
In conclusion: Carbon Credit Price India vs China 2026
Comparing the carbon credit prices in China and India reveals a landscape influenced by different sector coverage, market maturity levels, and governmental frameworks. China’s larger ETS and market evolution have encouraged credit prices closer to $14–$15 per ton, with significant volatility driven by local demand and regulatory revisions, whereas India’s early-stage pricing of about $10 per ton implies increased compliance and flexibility.
To navigate climate commitments, carbon management plans, and investment decisions, stakeholders in Asia and beyond must have a thorough grasp of these processes. The price systems in China and India will remain crucial factors in determining the sustainability, economic, and environmental results of the growing carbon credit markets.
Carbon Credits Income Tips for Beginners: Complete Guide to Earning from Carbon Markets in India
Carbon Credits Income Tips for Beginners: Complete Guide to Earning from Carbon Markets in India
4 Comments