Carbon Credit Price India vs Europe 2026
Carbon Credit Price India vs Europe 2026
One of the most established and significant carbon markets in the world is the European Union Emissions Trading System (EU ETS). Established in 2005, the ETS allots tradable permits (also known as EU Allowances or EUAs) that businesses must possess in order to cover their emissions and caps the overall amount of greenhouse gas emissions from regulated sectors. Because there are fewer allowances available, the carbon price tends to rise as the quota gets tighter each year.
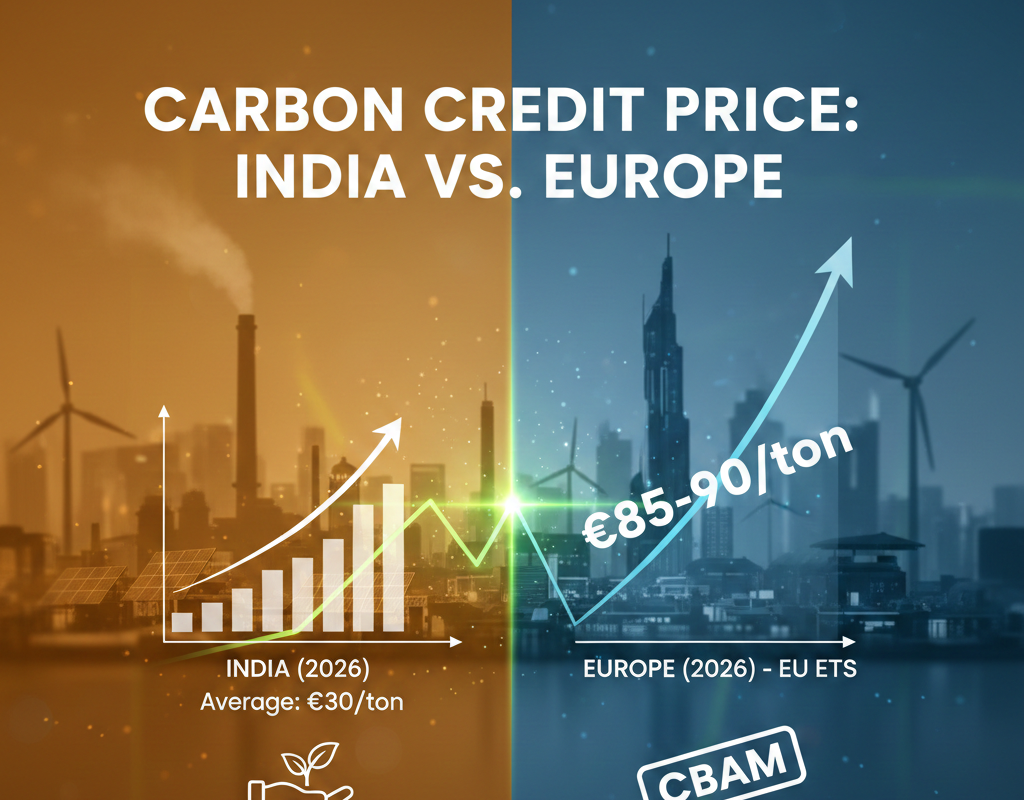
Early in 2026, the benchmark ETS carbon price was between €70 and €80 per metric ton of CO2, which was indicative of ambitious regulations and high demand for compliance. Nonetheless, recent political debates over price limits and market intervention have caused some price declines, indicating that markets are sensitive to both market sentiment and policy cues.

The Carbon Market in India: A Developing Structure and Anticipated Costs
Under the Carbon Credit Trading Scheme (CCTS) framework, India is currently developing its own carbon credit trading system, with the first trade anticipated to begin in 2026. Renewable Energy Certificates (RECs) and Energy Savings Certificates (ESCs), two voluntary offset mechanisms now in use, are giving way to a more structured trading system in India’s carbon market.
India’s initial program, which is based on project-based credits and intensity improvements, is anticipated to be more flexible than Europe’s rigid cap-and-trade model. Price formation is affected by this.
When the first compliance market appears, industry and government conversations indicate that the initial carbon credit pricing in India are probably going to be about USD 10 (around €9) per metric ton of CO2.
India and Europe’s Carbon Credit Prices: Seasonal and Structural Disparities
- The Reasons Behind Higher European ETS Prices
The substantial difference between the carbon costs in Europe and India can be attributed to a number of structural and policy factors:
- Enforcement and Maturity of Regulations
The ETS in Europe is completely controlled, and adherence is required. Businesses risk fines if they don’t maintain allowances that match their emissions. As businesses protect themselves from compliance requirements and regulators progressively raise the emission cap, this results in steady demand and price stability.
- Liquidity in the Market and Financial Integration
The financial and carbon markets in the EU are closely intertwined. Derivatives, options, and futures all significantly increase carbon trading, enabling price discovery and boosting liquidity. Because it attracts investors and amplifies price signals, carbon pricing has evolved into its own asset class.
Why Carbon Prices in India Could Remain Low
The prediction for domestic carbon prices in India takes into account various market features:
- Market Development in the Early Stages
India’s carbon market is still in its infancy. Early stages will probably concentrate on limited industry coverage and voluntary credit trading, which will cause the first price to be weaker. It might take some time for the market to reach the breadth and degree of enforcement observed in Europe.
- Balance of Economic Development
India places a high priority on decarbonization and equitable economic growth. Setting high carbon prices at first could burden consumers in underdeveloped economies and put financial strain on emerging sectors.
- Challenges in Policy and Structure
Regulatory harmonization, sectoral exclusions, and verification capacity limitations are some of the issues facing India’s carbon trading system. Price signals may remain subdued in the absence of robust governance and extensive MRV (monitoring, reporting, verification) systems.
Price Signals and Sectoral Effects
- Sectors Most Impacted by Variations in Carbon Prices
Different sectors are affected differently by border adjustments and carbon pricing:
- Cement and Steel
The majority of India’s exports to Europe come from these high-emission industries. Indian producers may face severe cost constraints as a result of higher European carbon prices and CBAM, which would encourage investments in cleaner technology, albeit at high capital costs.
- Power and Energy
The domestic trading plan has not yet fully incorporated India’s thermal power industry. Future inclusion might change the dynamics of prices, impacting industrial costs and the cost of electricity.
- Fertilizers and Chemicals
Chemical and fertilizer exporters to Europe must compensate for carbon costs. Businesses must account for the expenses of carbon compliance in their long-term planning due to the variation in carbon prices.
Conclusion: Carbon Credit Price India vs Europe 2026
The 2026 carbon credit prices in India and Europe reveal a notable difference, which is fueled by policy ambition, economic strategy, and regulatory maturity. As it develops capacity and regulatory frameworks, India’s nascent market is anticipated to start at about $10 per ton, whereas Europe’s ETS has set high compliance-driven pricing in the range of €70 to €80 per ton.
Given Europe’s CBAM and international climate commitments, this price disparity has real economic and trade ramifications. In order to maintain competitiveness and climate leadership, India must fortify its carbon market infrastructure, broaden the scope of compliance, and strategically integrate with global systems.
Carbon Credits Income Tips for Beginners: Complete Guide to Earning from Carbon Markets in India
Carbon Credits Income Tips for Beginners: Complete Guide to Earning from Carbon Markets in India